
USE CASE
Understand where recurring congestion and cut-through traffic come from
A school reports that drivers are rat-running through the school street to avoid the ring road. A circulation plan you introduced last year is up for review, and the council wants to know whether it actually reduced through-traffic. A junction keeps backing up at the same times every week, and nobody can say for certain where those vehicles came from or where they are heading. This use case is for the moments when you can see the symptoms, but your fixed measurements cannot tell you the story behind them.
- Road authorities and road operators
- Cities and municipalities
- Traffic engineers and traffic management centres
At a glance
- Problem
- Complaints and fixed measurements show where traffic problems are visible, but not why they keep returning.
- Evidence gap
- Loops, cameras and manual counts only capture fragments of the network and miss how traffic shifts across surrounding streets.
- Answer
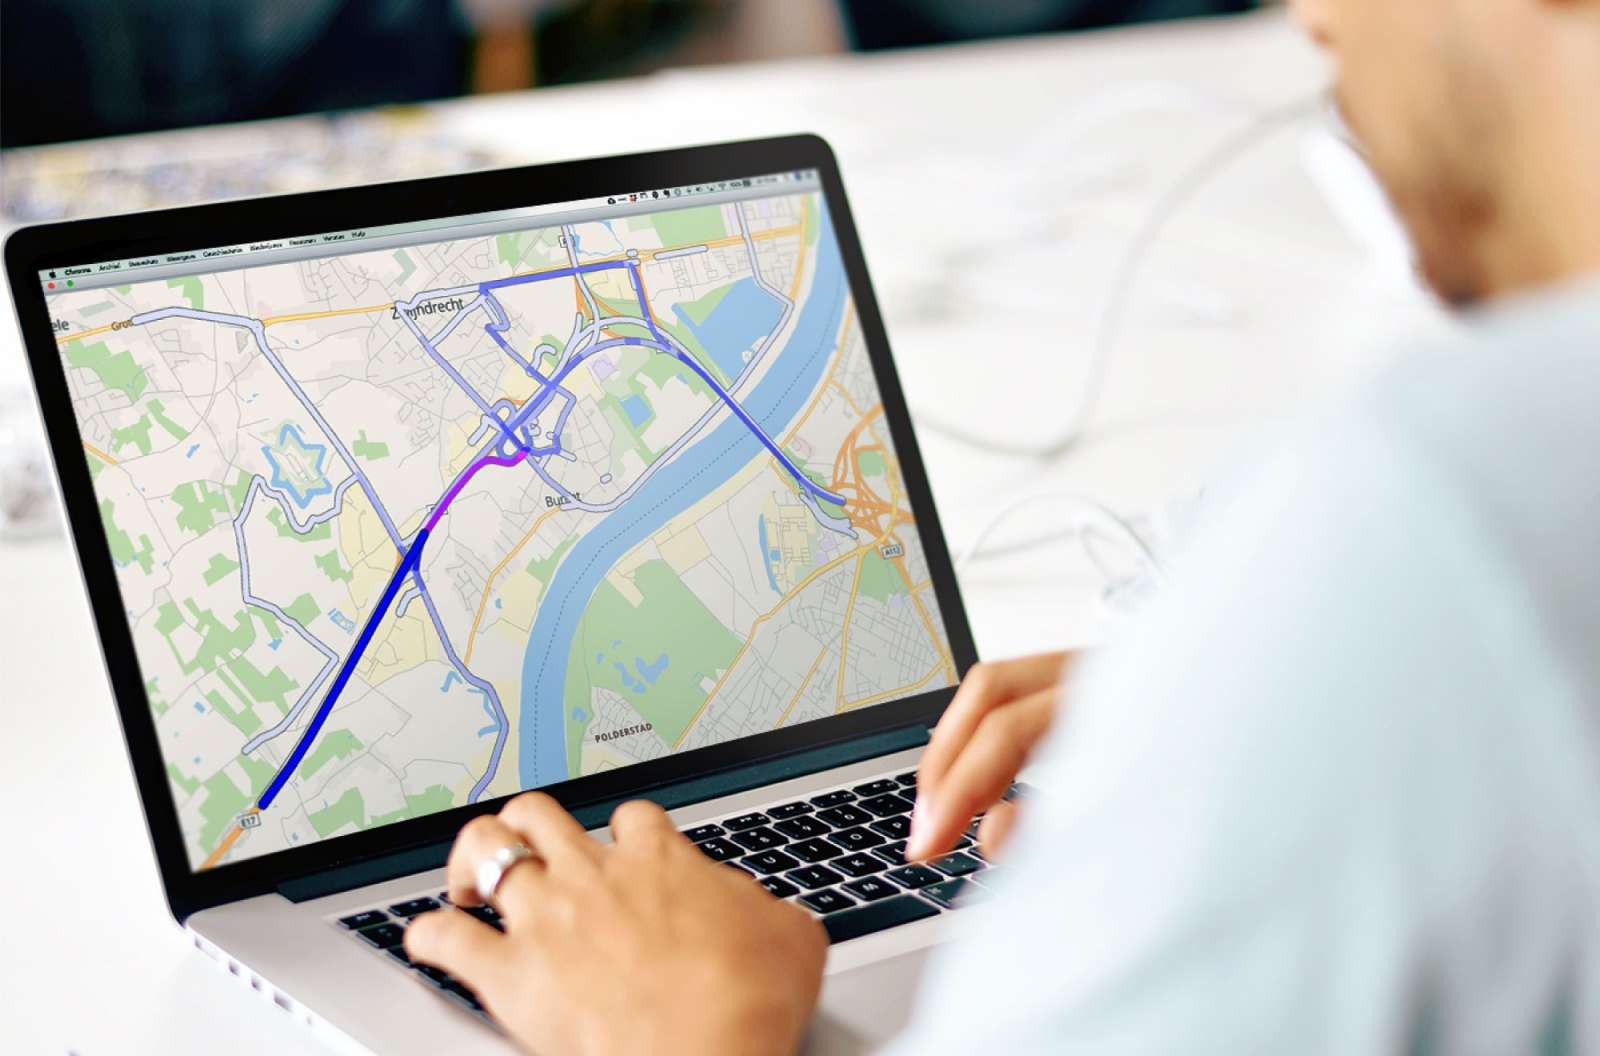
- Historical, network-wide traffic analysis reveals recurring bottlenecks, cut-through routes, origin-destination flows and before-and-after effects.
- Decisions supported
- Circulation plans, school streets, junction changes, access measures, roadworks evaluation and traffic policy discussions.
Why recurring congestion is hard to explain
A congestion complaint is not the same as a congestion pattern. Congestion returns at the same junctions because demand, route choice and network capacity interact in ways a single measurement point cannot capture. A queue on the ring road at 08:15 is not caused only by the vehicles standing in it; it is shaped by everyone who chose that route ten minutes earlier, by the school run two streets away, and by the signal programme on the corridor upstream. Cut-through traffic is even harder to see, because it happens precisely between the measurement points. By the time drivers are back on a monitored road, the diversion they took through a residential street is invisible. That is exactly why residents keep reporting rat-running that never shows up in the official counts.
Why fixed measurements miss the full picture
Loops in the road surface count the vehicles that cross them at a point and can classify some of them, but they say nothing about where those vehicles came from or where they are going. Cameras see the vehicles that pass in front of them and can read plates, but they do not observe the streets they did not turn into. Manual counts capture a single day at a single location and are rarely repeated. None of these methods reveals origin-destination flows, none shows how traffic redistributes when a measure is introduced, and none can be scaled cheaply across a whole neighbourhood. That is why before-and-after evaluation, cut-through detection and network-wide pattern analysis all fall outside their reach.
The answer: network-wide historical traffic analysis
To answer these questions, mobility teams need to move from isolated counting points to observed movement patterns across the whole network. Historical, network-wide traffic analysis makes that possible: by reconstructing how traffic actually behaved over time, it shows which routes drivers take, where traffic diverts, where congestion recurs and how patterns change after a measure is introduced. Instead of describing a single street on a single day, it describes the network as a system.
With this approach, mobility teams can:
- See exactly which routes drivers take to cut through residential streets and school zones, at which hours and in what volumes.
- Explain why a specific junction keeps backing up by tracing where the queuing vehicles came from and where they were heading.
- Compare measured traffic before and after a circulation plan, filter or signal change so you can show the council what actually changed.
- Understand how a bottleneck on one corridor pushes traffic onto parallel routes.
- Look back at recurring problems over weeks and seasons rather than a single day of counts.
- Answer complaints from residents, schools and local politicians with observed movement data instead of assumptions.
How historical traffic analysis works
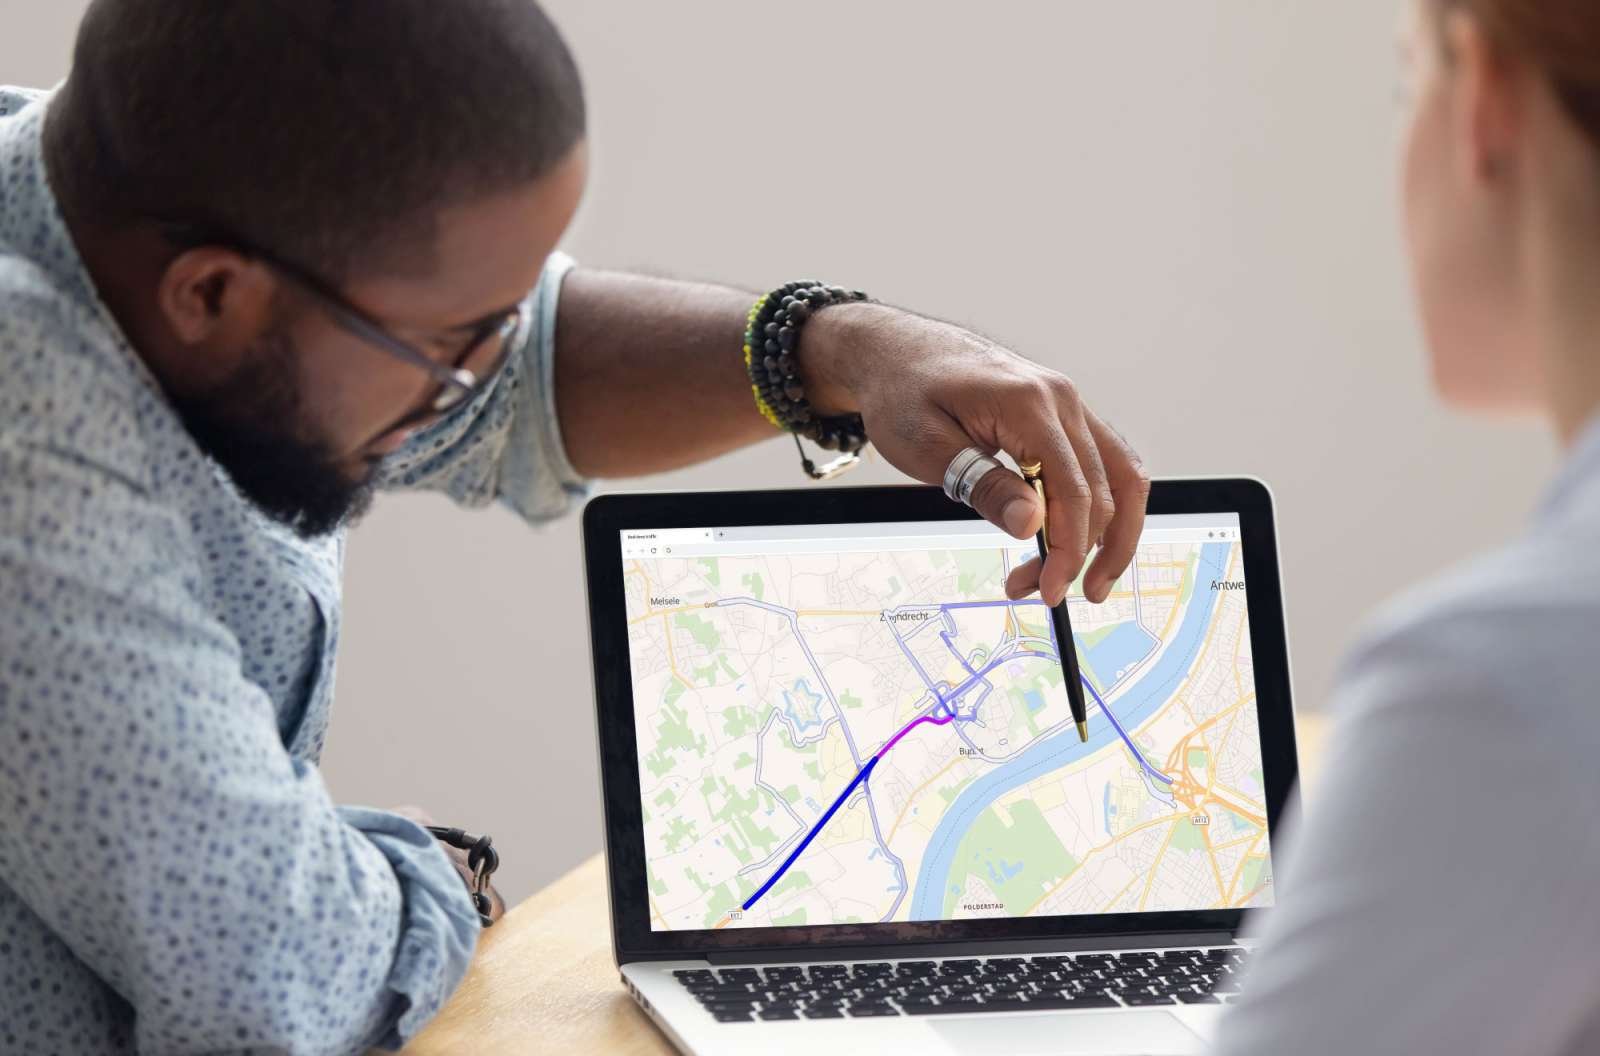
The method starts from movement data collected from vehicles already on the road. Those trajectories are aggregated and anonymised, then enriched with telco data, roadside sensors, camera feeds and public-transport data. Together, these sources reconstruct how traffic behaved across an entire network over time, not only at the points where instruments happen to sit.
That reconstructed picture supports four analytical views. Route analysis shows which itineraries drivers actually use between two areas, including alternatives to the main corridor. Segment analysis characterises how each road segment is used across the day and week. Origin-destination analysis reveals where journeys start and end, and how through-traffic passes through a neighbourhood. Historical maps let mobility teams look back at how the same road behaved over weeks, months or seasons.
On top of these views, tailored studies by traffic engineers can be layered whenever a specific policy question, such as evaluating a circulation plan or investigating a recurring bottleneck, needs a dedicated answer grounded in the same underlying data.
Who needs this evidence?
Road authorities and road operators
Need network-wide evidence to see where congestion recurs and how traffic shifts across corridors, beyond the points they already meter.
Cities and municipalities
Need to defend and evaluate school streets, circulation plans and local measures to residents and councils, not just count a single street.
Traffic engineers and traffic management centres
Need repeatable, network-wide movement data they can trust for studies, before-and-after comparison and recommendations.
The Be-Mobile technology behind it
Be-Mobile operationalises historical traffic analysis through FlowCheck, part of FlowSuite within the Traffic Management solution. FlowCheck helps mobility teams analyse route patterns, road segments, origin-destination flows and historical traffic maps, turning observed movement data into evidence for road authorities, cities and traffic engineers.
Explore FlowCheckFrequently asked questions
Ready to investigate traffic patterns across your network?
Use historical traffic intelligence to detect recurring bottlenecks, reveal cut-through traffic and support better mobility decisions.
Enabled by FlowCheck, part of FlowSuite.
Explore More